How to Create a 20-Page Interactive Report with a Single AI Prompt - on GENSPARK
A practical guide and case study on creating a complete, interactive, and brand-customized market analysis report using a detailed prompt with a generative AI.
In the world of consulting and data analysis, creating reports is a time-consuming yet essential task. The goal is always the same: to transform raw data into clear, impactful, and visually engaging insights. What if you could generate a 20+ page report that is fully interactive, animated, and adheres to a specific brand guide, all in minutes and with a single prompt? This is the experiment we conducted with Genspark, and the results exceeded our expectations.
The Challenge: A High-End Report, Without the Technical Effort
The need was clear: to produce an in-depth analysis of the 2025 coffee market, with a focus on Amazon France. But the requirements went far beyond a simple PDF. We wanted a dynamic web experience, accessible via a link, with animations, interactive charts, and smooth navigation. Traditionally, such a project would require a team of a data analyst, a UI/UX designer, and a web developer for several weeks. Our goal was to achieve it with a single command.
The Prompt: The Secret Recipe for a Perfect Result
The success of this operation hinged on one thing: the surgical precision of our prompt. Instead of vaguely asking for 'a report on coffee,' we structured our request like a true project brief. Here is the exact prompt we provided to Genspark:
Create a dynamic, interactive, and visually advanced report on the 2025 coffee sector, including:
Data & Structure to Include:
- Best-selling products (instant coffee, specialty coffees, whole bean, compatible capsules)
- Major innovations (fermented coffee, smart machines, personalization, cold brew / nitro coffee)
- Year-over-year data from 2019 to 2025 (Amazon France sales, volumes, estimated revenue)
- Consumption trends (at-home, social media, personalization, Asian market growth)
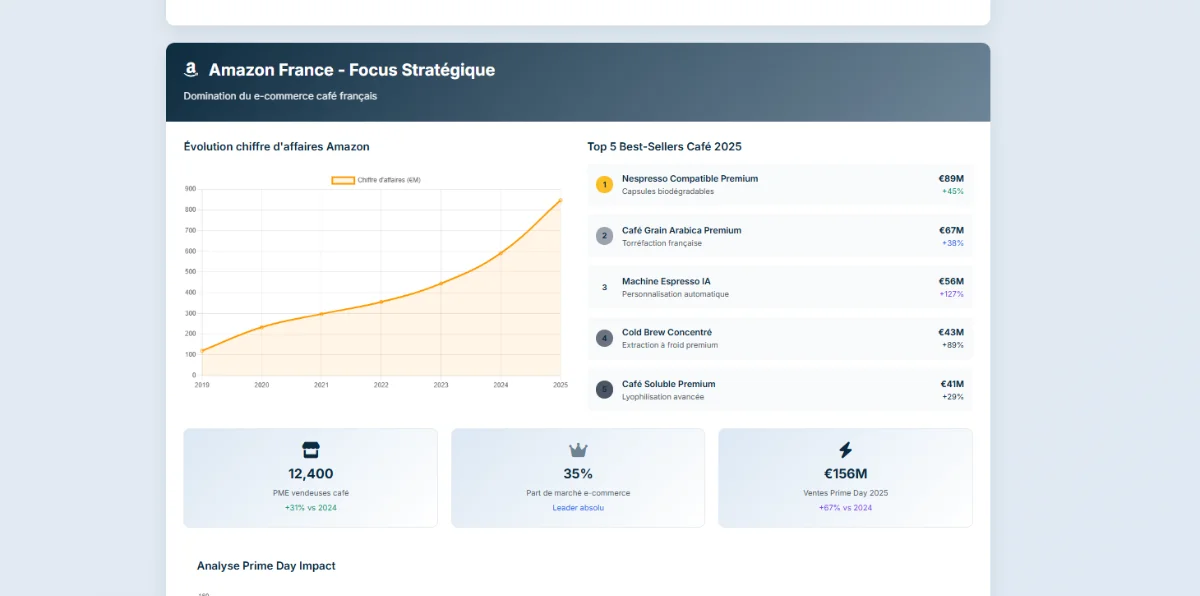
- Focus on Amazon France (sales trends, best-sellers, SME growth, Prime Day)
- ICO data on production/export volumes and coffee prices
Report Format:
- Fluid animations between sections
- Various charts (line, pie, bar, heatmaps, infographics)
- Dynamic maps to visualize regional growth
- Interactive timeline from 2019 to 2025
- Interactive sections: click on a product to see its detailed stats
Graphic Style:
- Color palette: night blue / light gray / pure white (#0C2A3F, #6D8496, #E6EBF1, #FFFFFF)
- Modern sans-serif font (Inter or Montserrat style)
- Rounded buttons, soft animations, light shadows
Report Tone:
- Serious, informative, yet engaging
- Accessible to an e-commerce decision-maker or investor
- Option to extract a strategic summary
Objective:
To understand and visualize all online coffee market dynamics between 2019 and 2025, with a focus on Amazon France, to inform a targeted e-commerce strategy.Why this prompt worked:
- Exhaustiveness: It covers the content (data), the form (design), and the function (interactivity).
- Precision: Hex color codes and font examples leave no room for interpretation.
- Structure: The prompt is organized into clear sections (Data, Format, Style, Tone, Objective), helping the AI understand the hierarchy of requests.
Key takeaways:
- Be an art director: Provide precise visual instructions.
- Think like an information architect: Structure the data you want to see.
- Define the end goal: Explain to the AI why you are requesting this report and who it is for.
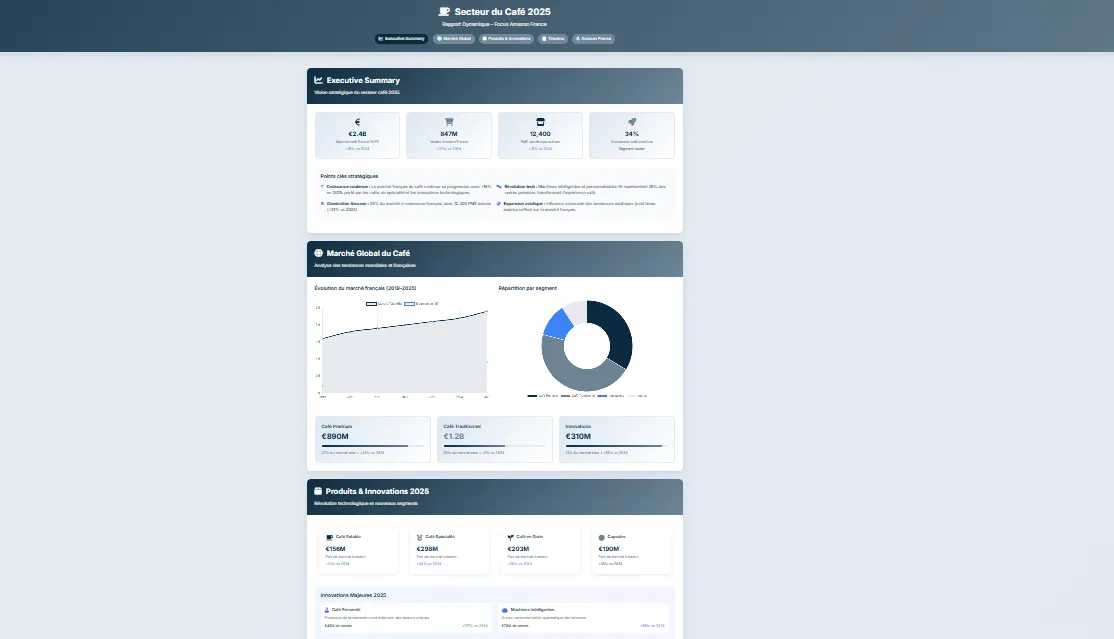
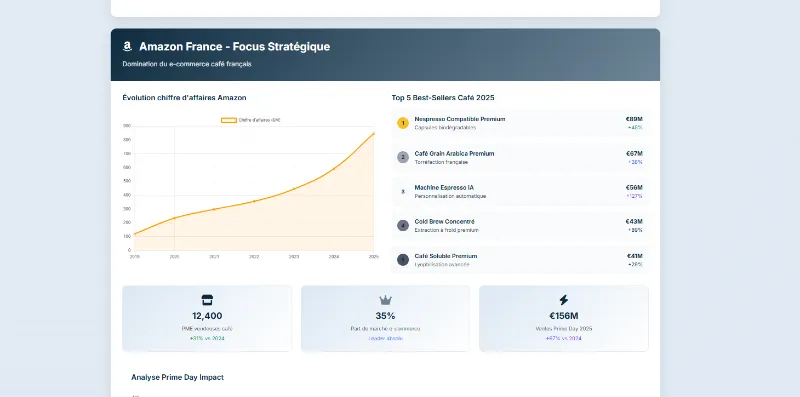
The Result: Beyond a Document, a True Web Application
In response, Genspark didn't just produce a file; it generated a complete webpage, hosted and accessible via a link. The final report included:
- Smooth navigation with animated scroll effects.
- Interactive charts where data appeared on mouse hover.
- A clickable timeline to filter data by year.
- Total adherence to the requested brand guide, from colors to typography.
- A responsive design, perfectly viewable on mobile and tablet.
This experience signals a new era for professional content production. The ability to brief an AI as one would a creative agency opens up incredible possibilities for productivity and quality. It's proof that mastering 'prompt engineering' is now a strategic skill.